Qualtik’s Bank Capital Ratios Dashboard
Community banks approaching or exceeding the FDIC regulatory 300% CRE Capital Ratio and/or the 100% C&D Capital Ratio need to demonstrate their understanding and management of CRE concentration limits and other areas of their risk profile to regulators. To provide this level of detail, community bank executives spend valuable time every month creating spreadsheets to monitor and report capital ratios.
Regulators and board members frequently ask bank executives questions about specific areas of concentration. Those requests often change based on the current economic environment and growth rates within the areas of concentration. With static spreadsheets, reporting bank capital ratios with this level of agility and customization is challenging.

Monitor CRE Concentration Limits, Bank Capital Ratios, & More
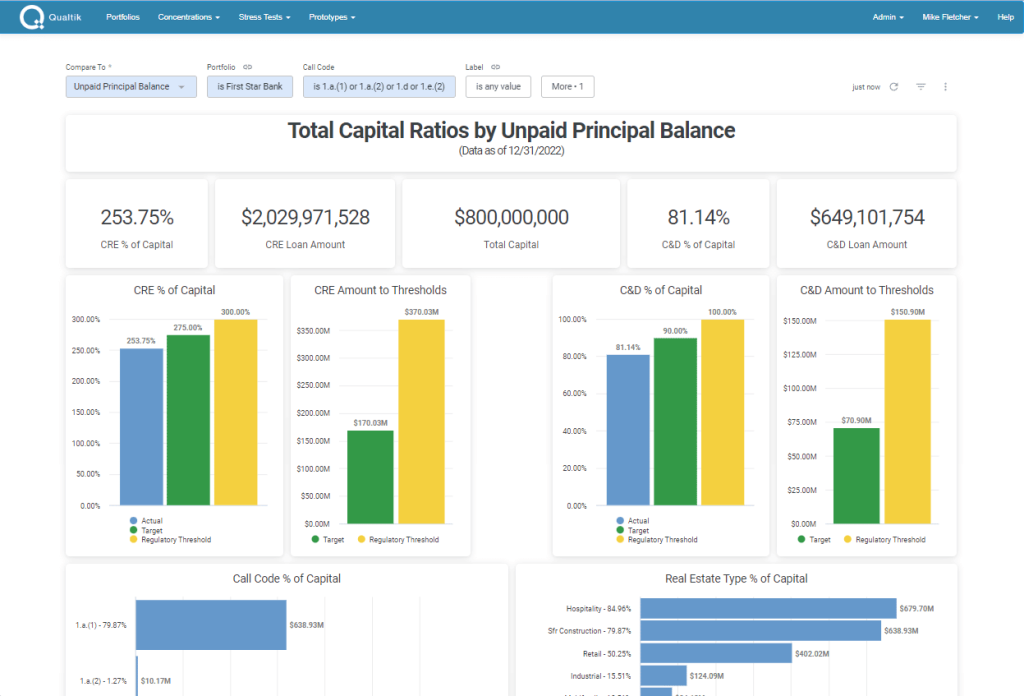
Qualtik’s Capital Ratios dashboard changes the status quo by providing automation and efficiency for bank executives in several areas, including:
- Insight into how the bank is performing against regulatory ratios, CRE concentration limits, and strategic targets established by bank leaders
- A report highlighting industries and real estate types where the highest percentage of capital has been deployed
- Instant visibility to lists by capital percentage from a wide variety of perspectives including risk grade, LTV, and debt service coverage ratio
- Quick access to loan level detail displaying what makes up each concentration
- Generation of professional reports in minutes, instead of hours
“Conversations with community banks drive our development roadmap,” said Qualtik CEO Mark Prior. “We heard a consistent description of a pain point related to capital ratio analysis and reporting. Hearing and seeing how much our customers benefit from this new dashboard makes it clear that we’ve been able to add value in an important area and it has already sparked new ideas and opportunities.”


